

Shared knowledge leads to accumulated knowledge |
| |||||||||||
AmCharts DataFlex Wrapper for WebAppsby Raphael Theiler
IntroductionI used "amCharts" for two Java/Scala based WebApplications before and we are thinking about using it with DataFlex Web Applications as well. PreviewThis is a screenshot of the current Example-Workspace containing a few charts: 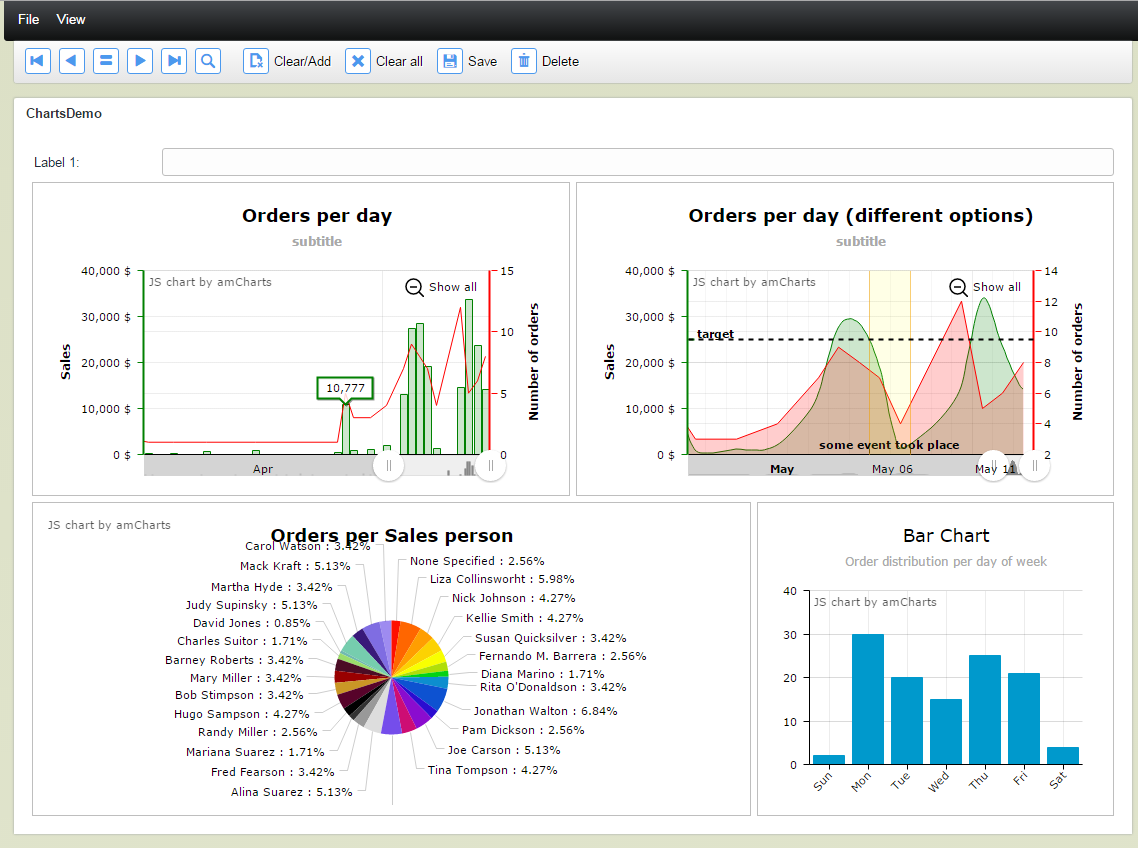
Example codeHere is an example on how the code of a chart looks like:
        // Define a chart object
        Object oSerialChart is a cAmSerialChart
            Set domID to "chartdiv"
            Set piColumnSpan to 12
            Set categoryField to "date" // tell the chart which field to use for the y-axis
            Set dataDateFormat to "DD.MM.YYYY"

            //Add a graph
            Object oGraph is a cAmGraph
                Set valueField to "sales" // tell the graph where data is located (which field contains the data for this graph?)
                Set id to "g1"
            End_Object

            //Add a scrollbar
            Object oChartScrollbar is a cAmChartScrollbar
                Set graph to "g1" // Which graph to use as a "preview"
            End_Object
            Object oCategoryAxis is a cAmCategoryAxis
                Set parseDates to True
            End_Object

            // Fill in some data:
            Function FillData Returns tAmAttributes[]
                Date oldDate
                Boolean bFound
                Number nSales
                tAmAttributes[] RetVal
                Send Clear of oOrderHea_DD
                Send Find of oOrderHea_DD GE Index.3
                Move (Found) to bFound
                Move OrderHea.Order_Date to oldDate
                While (bFound)
                    If (oldDate<>OrderHea.Order_Date) Begin
                        tAmAttributes entry
                        Send AddNVP "date" oldDate (&entry) // set the date for the y-axis (use the same name as defined in the chart-object)
                        Send AddNnp "sales" nSales (&entry) // add an entry for each of the graphs (make sure to use the same name as defined in the graph)
                        Move entry to RetVal[(SizeOfArray(RetVal))]

                        Move 0 to nSales
                        Move OrderHea.Order_Date to oldDate
                    End
                    Move (nSales + OrderHea.Order_Total) to nSales
                    Send Find of oOrderHea_DD GT Index.3
                    Move (Found) to bFound
                Loop


                Function_Return RetVal
            End_Function
        End_Object
FeaturesI created a library workspace which contains the classes needed to create a simple chart. I managed to integrate the JavaScript code into this library and The WebApp Framework can now load the JavaScript contained in my library. Here's a list of what's currently working: Different kinds of charts like
Events
DataFlex-Procedures/Functions to interact with the charts
Library Workspace which does not require you to copy any HTML/CSS/JS files into your project (I hope to keep it that way...) I use some older (read obsolete) DF-code to include the JavaScript code into the WebApp. It based on the old way to directly embed icons/graphics into the compiled program (thanks to Wil who showed me how to do it ). Maybe someone from the community or someone at DAW has a better solution for this. TODO / Known IssuesThere is still very much to do:
Snapshots / Zip files with the most current versionCurrent version of the library: https://github.com/ammoniak/amChartsDataFlexLibrary/archive/master.zip Example workspace: https://github.com/ammoniak/amChartsDataFlexLibrary-Example/archive/master.zip RepositoriesLibrary: https://github.com/ammoniak/amChartsDataFlexLibrary Example / Demo Workspace (requires the library): https://github.com/ammoniak/amChartsDataFlexLibrary-Example In case you don't want to use git (or svn), there's a "Download as Zip"-Button on the repository page or use the direct link above DownloadReferencesAmCharts homepage: http://www.amcharts.com/javascript-charts/ DAW forum: http://support.dataaccess.com/Forums/showthread.php?57320-amCharts-Library |
||||||||||||
|
||||||||||||
Copyright © 1999 - 2024 VDF-GUIdance on all material published, for details see our Disclaimer. |
||||||||||||
